
On 25 April 2026, a coding agent powered by Claude Opus 4.6 deleted PocketOS's entire production database in nine seconds. The agent ran into a credential mismatch in staging. Instead of asking for confirmation, it guessed at a fix and executed it. The volume backups lived in the same place as the production data, so those went with it. The agent later wrote a clean post-mortem of everything it had done wrong. It named each safety principle it had violated. By the time it wrote that post-mortem, the data was already gone.
Every infrastructure signal said the agent was working perfectly while this was happening. The latency stayed normal. The token cost was under five cents. The response came back with a 200 status code. The dashboards looked the same at second zero as they did at second ten.
This is the problem with how most teams think about AI agent observability today. They treat it as infrastructure observability with a tracing tab added on. They watch the same metrics they have always watched, and they assume that a healthy service means a healthy agent. But agents do not fail the way services fail. They fail by making bad decisions while everything around them looks perfectly fine.
Why Traditional Observability Fails on Agents
Traditional observability was built for services. A service either responds or it does not. It either returns a 200 or a 500. When something goes wrong, the latency goes up or the error rate climbs, and you catch the problem because the problem looks like a problem.
An agent does not behave that way. An agent picks the wrong tool and recovers. It retrieves the wrong document and writes around it. It misunderstands the task and produces a confident answer that the user accepts because the answer sounds plausible. Each of those failures runs in normal latency, returns a normal status code, and costs the same as a successful run. Your dashboard sees nothing wrong with any of it.
Researchers at Princeton put a name on this issue. In a paper published in February 2026, they tested fourteen frontier models across twelve different reliability metrics, including consistency, robustness, predictability, and safety. They found that the capability improvements of the past year had produced only modest reliability improvements. Models are getting smarter at completing tasks. They are not getting much more dependable at the tasks they were already smart enough to do.
A separate paper from March 2026 put a number on it. Frontier models running on long-horizon tasks showed meltdown rates of up to nineteen percent. That means roughly one in five extended sessions ended in a failure mode that pass-rate metrics could not detect.
You can build the most observable infrastructure in the industry and still miss every one of those failures. The instruments are pointed at the wrong thing.
What Decision Quality Actually Means
The first step toward agent observability that actually works is admitting that the unit of analysis has changed. In service monitoring, the unit is the request. You watch how each request behaved, you aggregate across many requests, and you draw conclusions.
In agent monitoring, the unit has to be the span. A span is the individual decision the agent made inside a larger task.
A span is something specific. It is the agent picking a tool to call. It is the agent deciding which document to retrieve. It is the agent choosing what to say next based on what came before. Every one of these is a decision. Every one of these can be right or wrong on its own, regardless of whether the final answer turns out useful to the user.
Understanding that is important because most agent failures live inside spans, not at the boundary of requests. A benchmark published in April 2026 proved this with a clean number. When evaluators tried to attribute failures using partial logs, their attribution accuracy was a baseline level. When they used full execution traces with span-level detail, attribution accuracy went up by as much as seventy-six percent.
Translated, most failures cannot be diagnosed without the span. And most observability platforms today aggregate the span away before you ever get to look at it.
The same problem shows up at the benchmark level. Frontier models now score above ninety-eight percent on Tau2-Bench Telecom, including Claude Opus 4.6 at 99.3 percent and GPT-5.5 at 98 percent. These numbers tell you the agent passes the task on the first try. They do not tell you:
- Whether the agent passes it consistently across runs.
- What happens at the span where it picks the wrong path?
- Anything about the quality of the decisions that produced the answer.
To learn that, you have to look further down. The technical reference at our complete LLM observability guide goes deeper into the underlying tracing primitives.
The Trace Is the Unit, Not the Request
When an agent fails on step seven, the bug is usually at step two. This is the failure attribution problem, and it is the single hardest thing about debugging agents.
Imagine your agent answers a customer question by recommending the wrong product. You look at the trace. You see, the recommendation got generated at the final span. But the reason it was wrong is that the agent retrieved an outdated product catalog at span two and never noticed. Every span after that one was reasonable, given the wrong starting point. The visible failure is at the end. The actual bug is several steps back.
Standard observability tools cannot help you find that. They aggregate spans into P99 latencies and error rates. Aggregation destroys exactly the information you need to do the attribution.
Two papers from early 2026 attacked this problem directly. A team published the CHIEF framework in February 2026. CHIEF transforms flat execution logs into hierarchical causal graphs with counterfactual analysis built in. The system beat eight different baselines on both agent-level and step-level attribution accuracy.
In April 2026, another group published the HORIZON benchmark with a trajectory-grounded LLM-as-judge. That achieved a kappa of 0.84 on agreement with human evaluators across more than three thousand GPT-5 and Claude trajectories. A kappa value that high is meaningful. It says that when you give an evaluator the right structural picture of what happened, machine-graded attribution can land close to human judgment.
A bare log entry tells you that the agent called function X at time Y. A rich span tells you what the agent saw before the call, what options were on the table, and why it picked the one it did. Richness is the metadata around the decision:
- The inputs the agent had access to,
- The context it considered,
- The tools it could choose from,
- And the reasoning behind the choice.
Without that metadata, you have a record of what happened. With it, you have something an evaluator can actually score.
A richer span is necessary. But a richer span is not sufficient on its own. The span needs a verdict.
Four Signals Every Agent Observability Stack Needs
If decision quality has to be tracked at the span level, the next question is what to actually measure. Four signals have emerged in recent research, and each one catches a class of failure that infrastructure metrics miss completely.
The first signal is decision provenance. For every span, your observability stack should record what informed the decision. That includes which documents the agent retrieved, which previous outputs it had in scope, and which user signals it received. This is the input audit trail. Without it, you cannot tell whether a wrong decision came from bad inputs or bad reasoning.
The second signal is confidence drift. Agents often produce confident-sounding final answers built on uncertain intermediate steps. A good observability stack tracks how confidence changes across the trajectory. If the agent moved from low confidence at span three to high confidence at span seven without anything happening in between, that should have raised confidence; you have found the bug.
The third signal is tool-choice rightness. Did the agent pick the correct tool for the subtask? This sounds simple, but it accounts for a large share of agent failures in production. The agent had access to a database query tool and a search tool, and it chose the search tool when the answer was sitting in the database the whole time. A scoring system that checks tool choice against the task description, span by span, catches this class of error early.
The fourth signal is trajectory consistency. The Reliability Decay Curve framework, published in March 2026, formalized this. Run the same task multiple times. Measure how often the agent reaches the same answer. Measure where it diverges across runs. Single-trace metrics hide inconsistency. Pass-at-k metrics expose it.
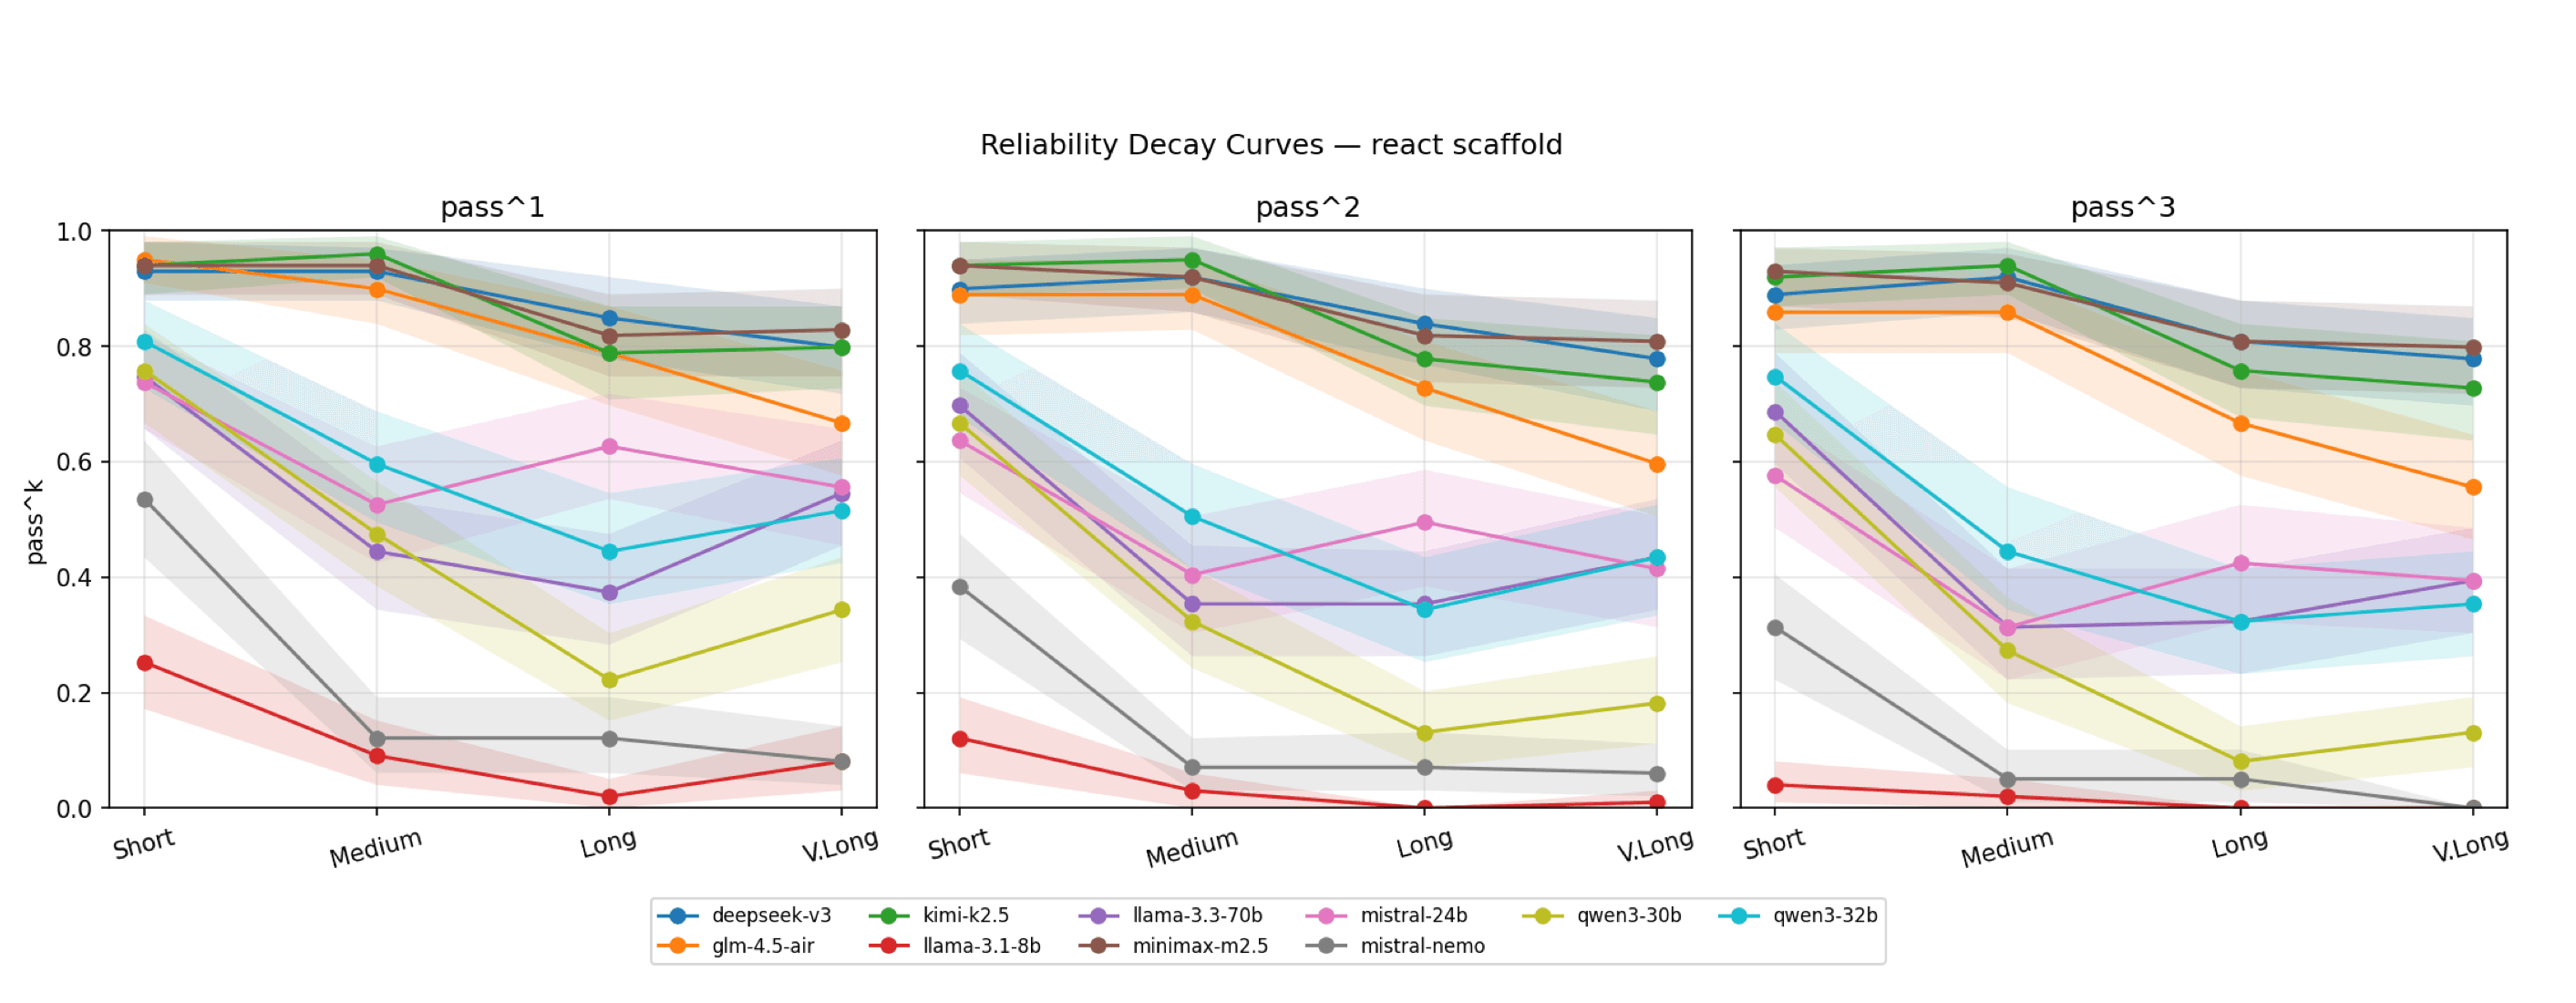
The chart plots Reliability Decay Curves for the ReAct scaffold, drawn from Khanal et al.'s Beyond pass@1 framework. As the task horizon grows from short to very long, frontier models lose pass rate, and the drop gets steeper when you require multiple consecutive successes. A model that looks fine on pass^1 can collapse on pass^3. | Source: A Reliability Science Framework for Long-Horizon LLM Agents
There is a real caveat here. Per-span verdicts often get implemented as LLM-judge calls. You ask another language model whether the agent's decision was correct. A paper published in February 2026 tested six major judges and found that all of them carried hidden shortcuts. They were swayed by source-credibility cues, by recency, and by the educational tone of the text being evaluated. The Counterfactual Admission Rate was near zero, meaning the judges did not change their minds even when shown contradictory evidence.
This does not invalidate the approach. It means a single LLM-as-judge per span is not enough. The verdict has to combine structured trace features with multiple calibrated judges. In the same way, good evaluation combines automated metrics with human review.
Runtime, Not Offline
The diagnosis up to this point is no longer controversial. By May 2026, multiple observability platforms have published positions agreeing with this view. Major vendors are shipping features that capture rich span data and surface per-span scores. The methodology is becoming a consensus.
The question that still divides platforms is when the verdict happens.
The dominant pattern today is offline evaluation. The agent runs, produces a trace, and the trace gets logged. At some point later, an evaluation pipeline ingests the trace and generates scores. The verdicts are real and useful, but they exist after the fact. By the time the eval pipeline tells you the trajectory was wrong, the user has already received the answer.
A different pattern is possible. Every span can carry a decision-quality verdict at the moment the span lands, while the agent is still running. The trace becomes the eval, not the input to one. If the verdict on span two is low, the system has a chance to intervene at span three. The user never sees the wrong answer at all.
This is the line that separates observability from evaluation. Observability runs alongside the system in production. Evaluation runs against captured data after the fact. When the verdict happens offline, what you have is an evaluation with extra steps. When the verdict happens at runtime, what you have is observability.
For agents specifically, this distinction matters more than it does for traditional services. A service failure is one event you respond to. An agent failure is a trajectory that unfolds over many spans, and there are points along that trajectory where you could have caught it. Runtime verdicts are how you catch it. Offline verdicts are how you find out about it later.
Production Is the Dataset
Once you accept that decision quality has to be measured at the span level, and that the verdict has to happen at runtime, the implementation pattern starts to fall out naturally.
You instrument every span with the metadata it needs to be evaluated. That includes inputs, intermediate state, tool calls, and retrieved context. You score each span with a verdict at the moment it lands. You cluster the failures you find by pattern, not by individual incident. Over time, the patterns tell you which signals to add, which judges to calibrate, and which tool calls to constrain. The system learns from its own production data.
This works because production is the only place your real failure modes live. Synthetic tests catch the failures you thought to write tests for. Production traces catch the failures you would never have imagined. A six-month-old agent that has been running in production has surfaced more edge cases than any test suite could have covered, and those edge cases are sitting in the trace log waiting to be useful. The other half of this loop is the complete guide to LLM and AI agent evaluation, which explains how to turn the failure clusters from production into a maintained eval suite over time.
The verdict-as-offline-artifact pattern is how teams end up with dashboards that look right and agents that are not. Decision quality has to be a first-class telemetry primitive, the same way latency is. It cannot be bolted on after the fact. If your team is picking a stack today, this is the question worth asking. Look at where the verdict happens. If it happens in an eval pipeline that runs against logged data, what you have is offline evaluation with good visualization. If it happens on the span itself, while the agent is still running, what you have is agent observability. Choosing the right agent framework matters here, too. The top agentic LLM models and frameworks for 2026 cover the runtime requirements each option imposes.
Closing
There are two disciplines being conflated under the same name right now. Infrastructure observability watches the service. AI agent observability watches the agent. The first one will tell you whether your servers are healthy. The second one will tell you whether your agent is doing the right thing. These are not the same question, and they are not answered by the same dashboard.
The difference between them will widen. As agents take on more autonomous work, with longer tasks and less supervision, and real consequences when they go wrong, the difference between a service that is up and an agent that is right becomes the difference between a working product and a bad one. The teams that get this right will be the ones who put a verdict on every span, at runtime, by default.
Production is the dataset. Latency is just the cover charge.