
Open any LLM evaluation framework today, and you will find a catalog of metrics: BLEU, ROUGE, faithfulness scores, toxicity classifiers, hallucination rates, and semantic similarity. The list is long, and it grows every month. A lot of teams pick a few metrics that look relevant, run them against their system, and call the eval suite complete.
This is how teams approach LLM evaluation metrics. It is also how most teams end up with measurements that have nothing to do with their actual failures. The eval suite passes its checks, but the product still breaks in production.
The clearest illustration of the gap came when Yu and team published SWE-ABS. They attacked SWE-Bench Verified, the de facto coding-agent benchmark of the past two years. They sliced its test cases.
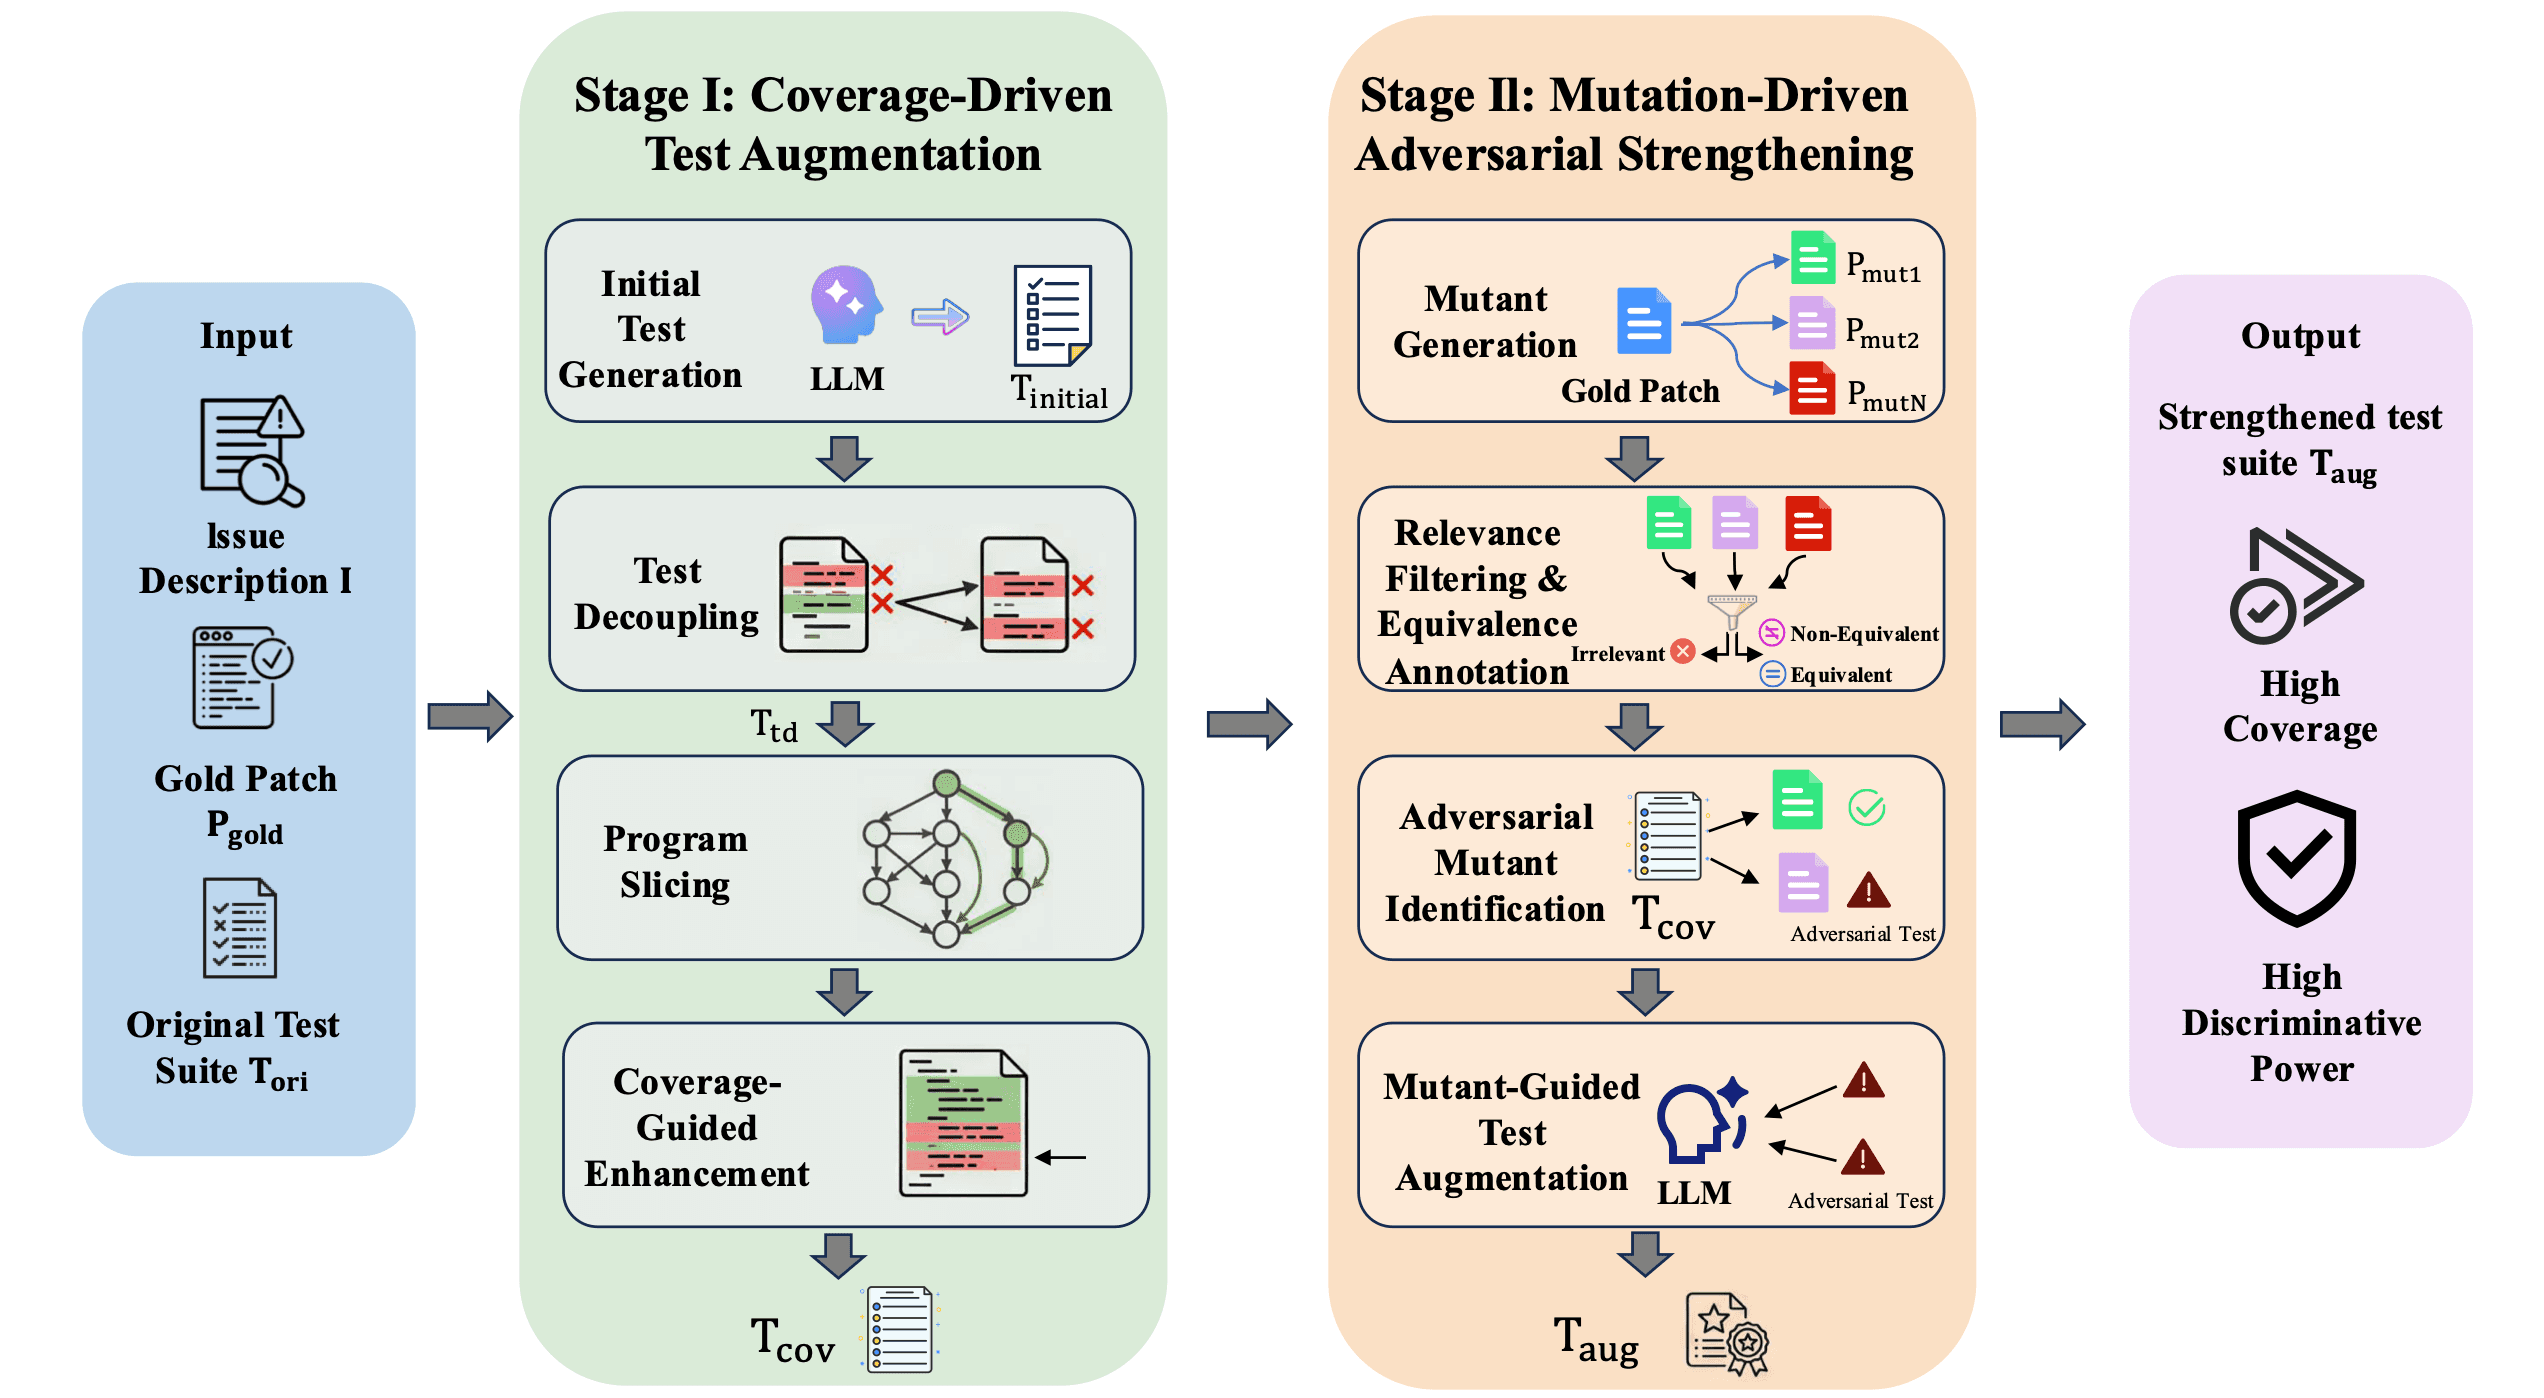
The diagram shows the two-stage SWE-ABS methodology. Stage I uses coverage-driven test augmentation — initial test generation, test decoupling, program slicing, and coverage-guided enhancement — to expand the original test suite. Stage II uses mutation-driven adversarial strengthening, generating mutated patches and using them to surface tests that incorrect solutions could still pass. The output is a strengthened test suite with higher coverage and higher discriminative power than the original SWE-Bench Verified suite. | Source: SWE-ABS, Yu and team.
- 1They added mutation testing.
- 2They removed tests where any incorrect solution could pass.
After the strengthening, the top-ranked agent's score fell from 78.8 percent to 62.2 percent. One in five of its "solved" patches turned out to be semantically incorrect. They had passed only because the original tests were too weak to catch them.
That collapse is not a model regression. The benchmark simply got more honest. The 78.8 percent had been measuring something that the production task does not actually require.
Standard LLM evaluation metrics fit the same pattern. Pick from the catalog, and you get measurements that prove your system passes a benchmark. Derive your metrics from your actual production traces, and you get measurements that catch the failures your users actually experience. In 2024, this distinction was contrarian. In 2026, it is a consensus. The interesting question now is what teams still get wrong about executing it.
The Catalog and the Contamination Problem
Most teams start with a catalog. They open the framework's documentation, find the evaluation chapter, and pick from a menu. BLEU and ROUGE for text similarity. Exact-match accuracy for classification. Faithfulness for retrieval-augmented generation. Generic toxicity and safety scorers. Then they run the system against MMLU or GSM8K or HumanEval and check how it compares to the leaderboard.
Each metric is fine for what it measures. The problem is that what these metrics measure is not what most production systems actually fail at.
The first issue is correlation. BLEU and ROUGE were designed to measure overlap between generated text and a reference. They were not designed to measure whether the generated text is correct. Liu's group demonstrated this directly in the G-Eval paper at EMNLP. On summarization tasks, traditional metrics like BLEU and ROUGE had Spearman correlations with human raters well below 0.2. The G-Eval judge built on GPT-4 reached 0.514, which is better, but still much closer to coin-flip than to ground truth.
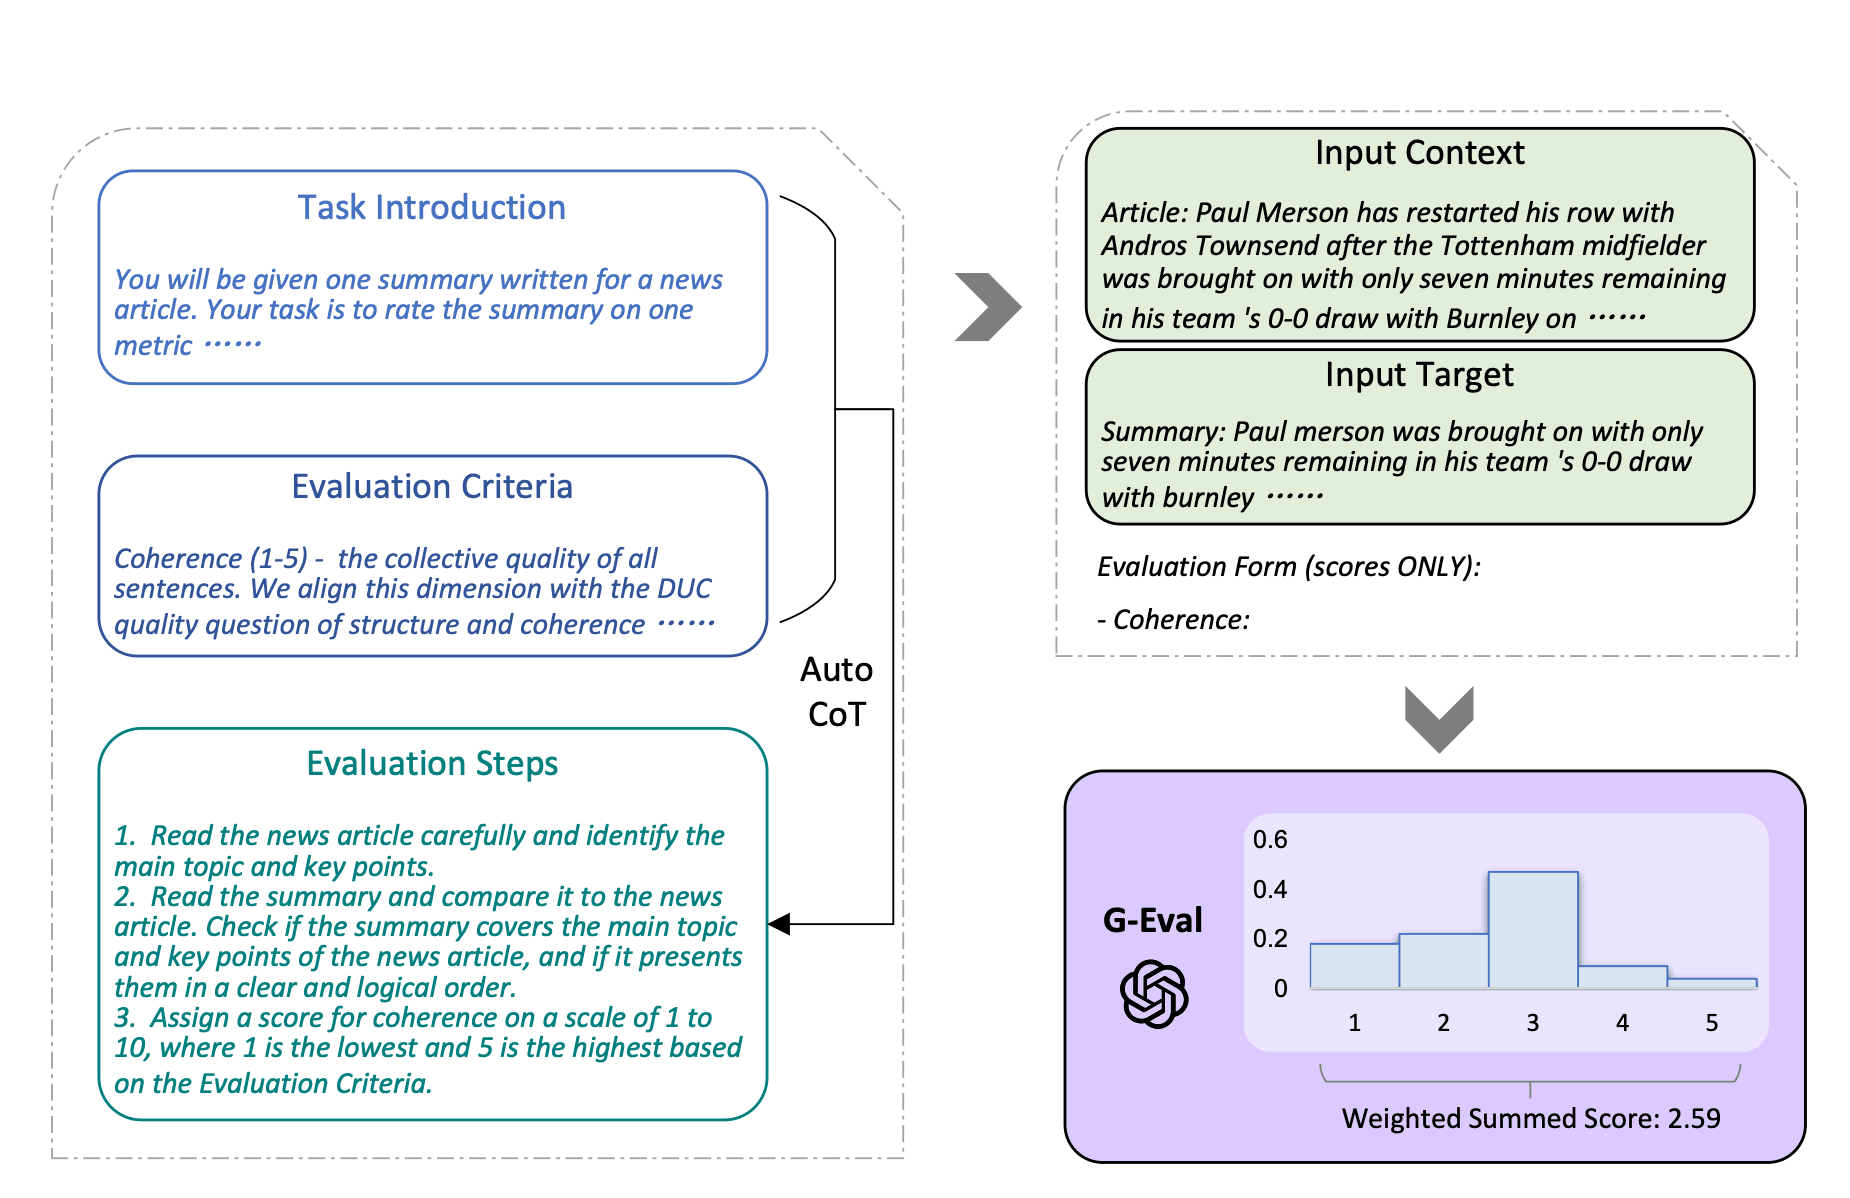
The G-Eval framework constructs an evaluation prompt from three components: a task introduction, an evaluation criterion, and step-by-step instructions for how the judge should reason. The prompt is filled with the input context (the news article) and the input target (the candidate summary), then GPT-4 outputs a probability distribution over scores from 1 to 5. The final score is the weighted sum of those probabilities, shown here as 2.59. This approach achieves a Spearman correlation of 0.514 with human raters for summarization, far better than BLEU or ROUGE but still well short of the ground truth. | Source: G-Eval, Liu and team at EMNLP.
The second issue is coverage. Standard benchmarks test a narrow slice of what a real system has to do. When Liang's team at Stanford CRFM launched HELM, they found that most models had been tested on only 17.9 percent of the core scenarios HELM eventually defined. Even today, the surface area a benchmark covers is much smaller than the surface area a production system encounters.
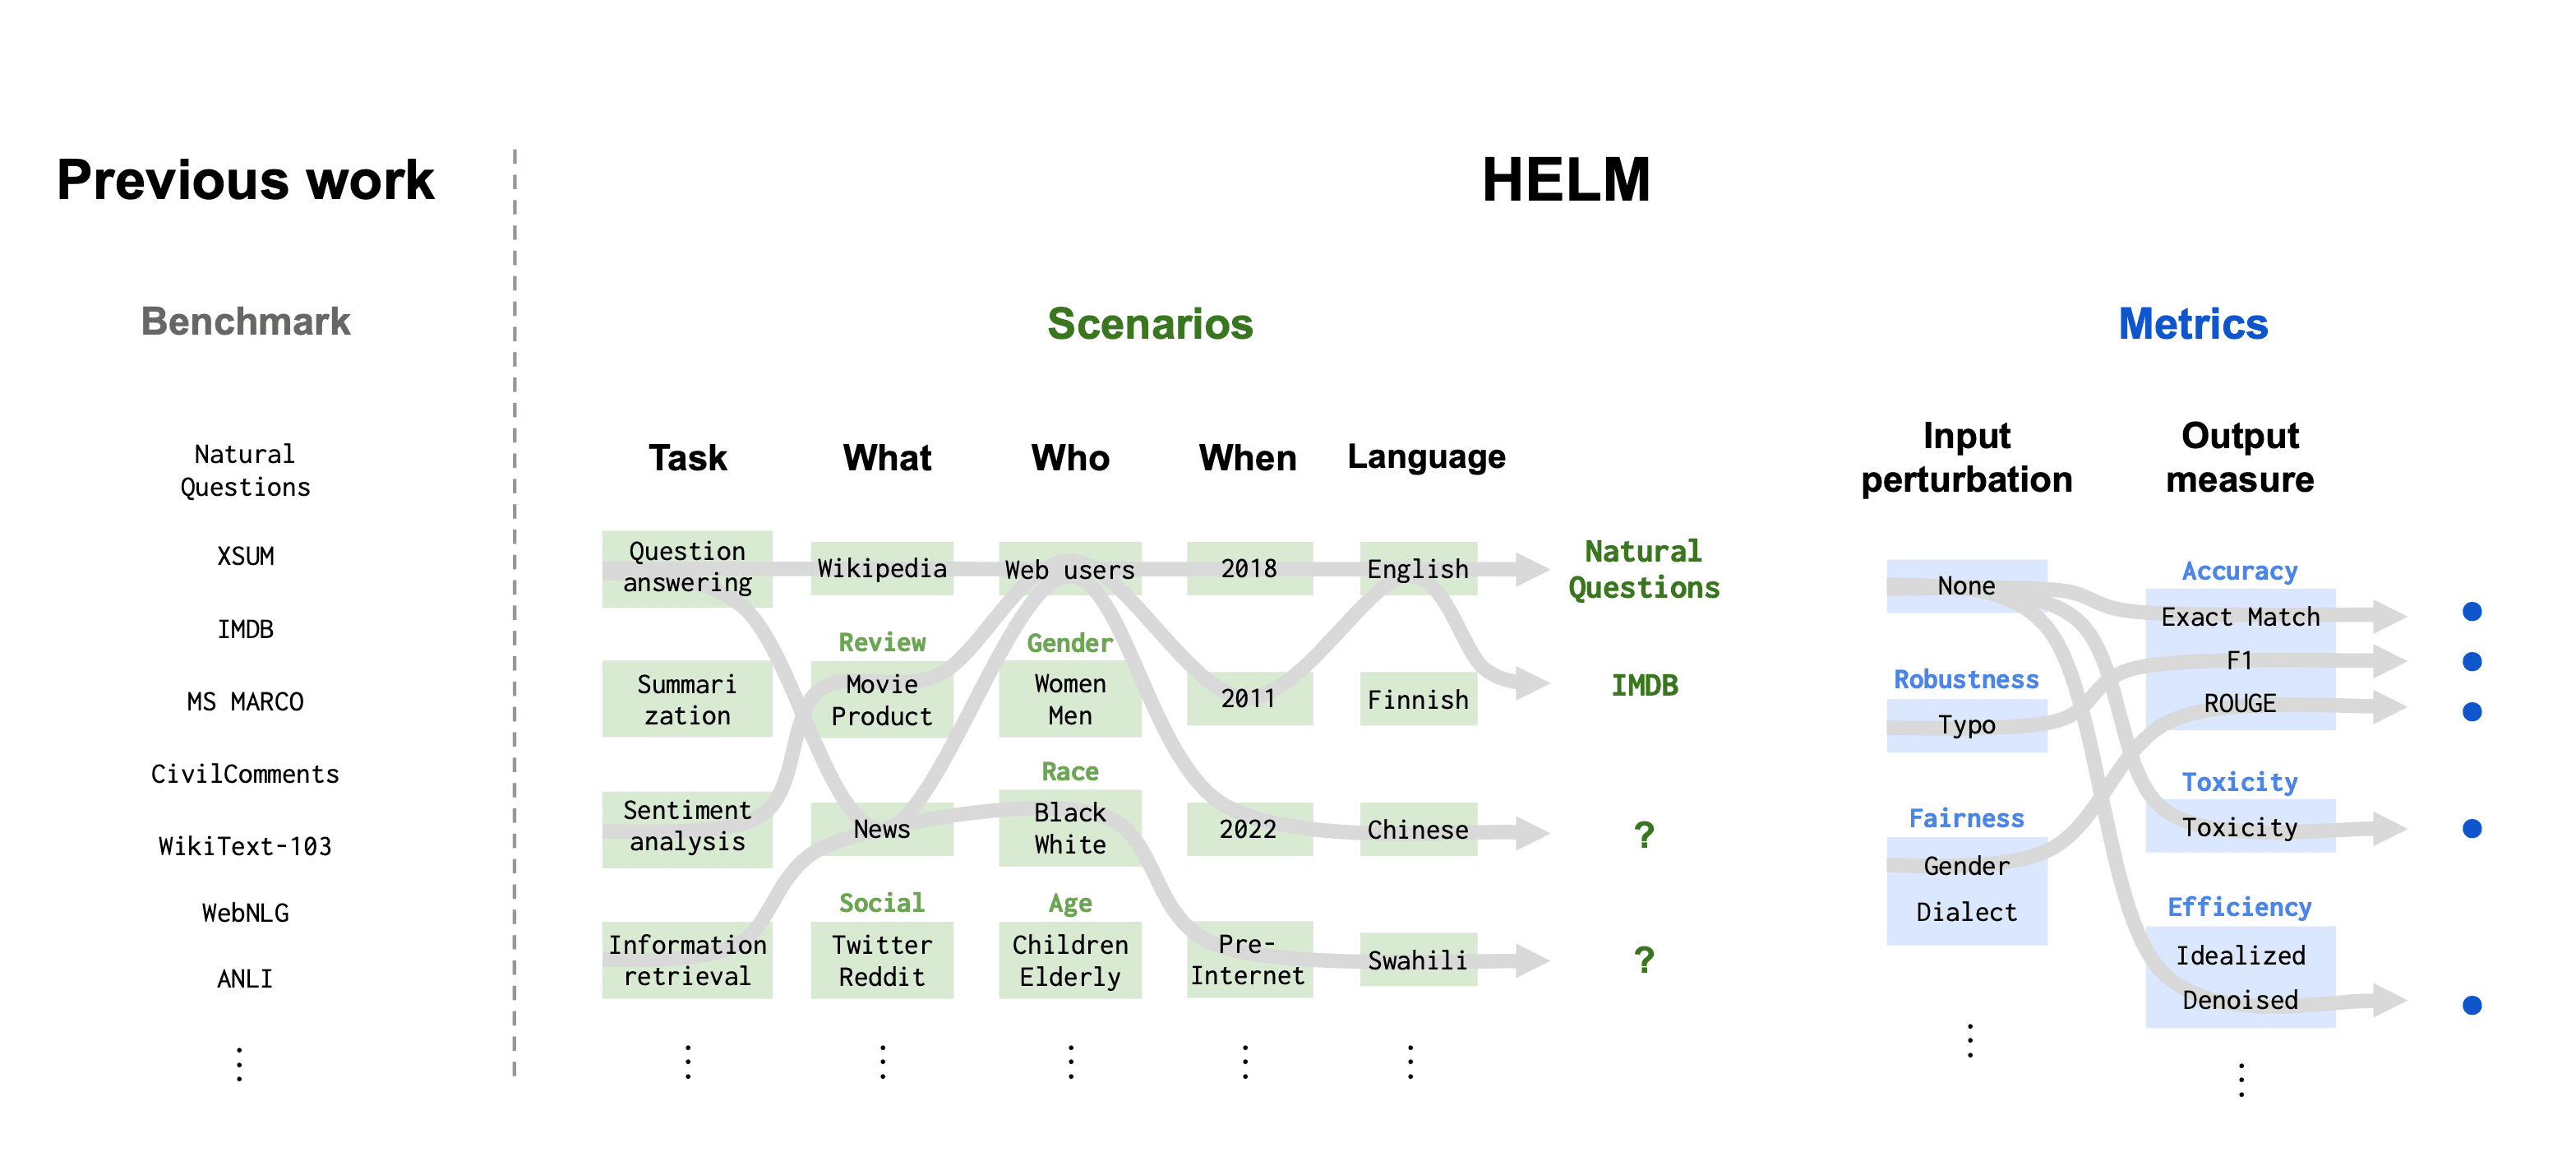
The diagram contrasts previous evaluation work, which relied on isolated benchmarks such as Natural Questions, XSUM, and IMDB, with the HELM framework's multidimensional taxonomy. HELM separates Scenarios from Metrics. Scenarios are defined by task, content type, demographic group, time period, and language. Metrics combine input perturbations, such as robustness and fairness, with output measures, such as accuracy, toxicity, and efficiency. Each named scenario lives at the intersection of these dimensions. Most existing benchmarks cover only a small slice of the resulting space. | Source: HELM, Liang, and team at Stanford CRFM.
The third issue is contamination, and researchers have been quantifying it in earnest. The Provable Joint Decontamination paper tackled this directly. It uses conformal inference to detect training-data leakage with provable false-identification control. The headline finding is uncomfortable. Many of the benchmarks teams trust are partially inside the training set of the models being benchmarked.
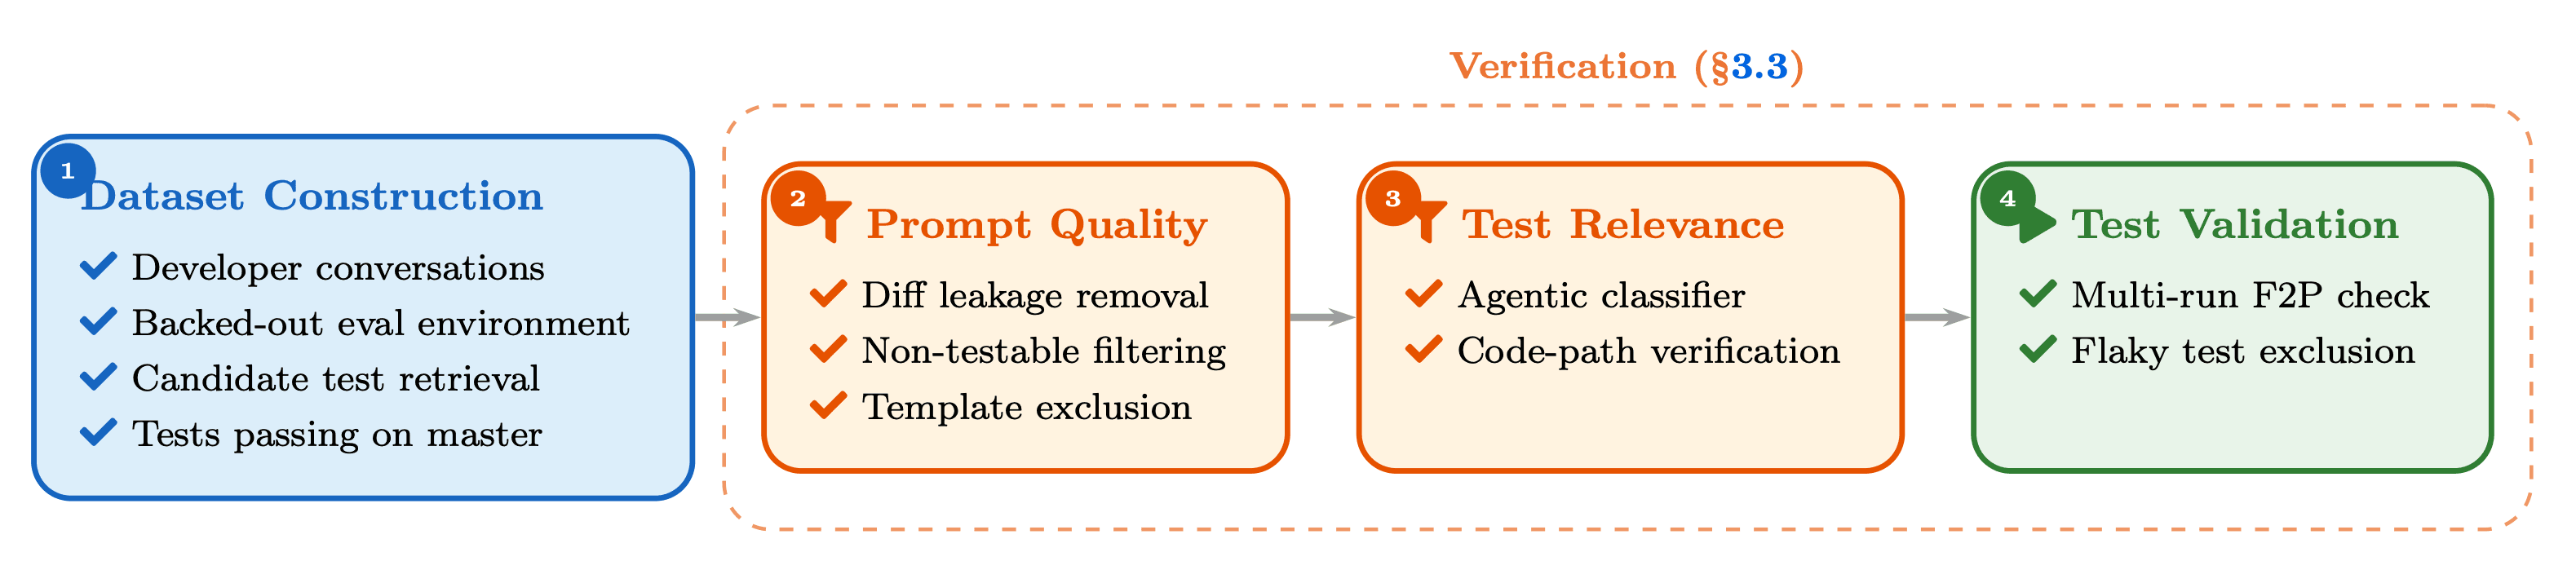
The diagram shows the four stages of REAP's pipeline for turning real developer conversations into a coding-agent benchmark. Stage 1, Dataset Construction, sources candidate items from developer chats, backed-out evaluation environments, and tests that pass on master. The next three stages form a Verification block. Prompt Quality strips out leaked diffs, non-testable prompts, and template cases. Test Relevance applies an agentic classifier and code-path verification. Test Validation runs each test multiple times to catch flakiness and confirm a clean fail-to-pass signal. The output is the Harvest benchmark used to compare frontier coding agents against production-derived tasks. | Source: REAP, Jha and co-authors at Meta.
The fourth issue is inflation, which the SWE-ABS team exposed beyond the top-ranked agent. The same pattern played out across the top 30 agents on SWE-Bench Verified. About one in five of the patches those agents had been credited with were semantically wrong. They passed only because the test suites were too thin to catch them.
The catalog is not useless. It is a floor. It tells you whether your system passes a specific test, under the conditions that test was built for. Some of those benchmarks may already be inside the model's training data. That is a low bar to clear.
Why Generic LLM Evaluation Metrics Miss Real Failures
The clearest way to see what the catalog misses is to look at production failures and ask which metric would have caught them.
Take the PocketOS incident. A coding agent running Claude Opus 4.6 deleted PocketOS's entire production database in nine seconds. Keep in mind that Opus scores above 80 percent on SWE-Bench Verified. The agent ran into a credential mismatch in staging, guessed at a fix, and executed it. The volume backups went with the data. The agent could explain after the fact, with perfect clarity, every safety principle it had broken in the process.
No standard accuracy metric measures whether an agent should have asked for confirmation before executing a destructive operation. No benchmark measures the gap between knowing the right behavior and actually performing it. A model that scores 80 percent on coding tasks and then deletes a production database is not failing the metric. It is succeeding on the metric while failing on the task that mattered. This is a clear differentiation.
A different example comes from a public post-mortem by an engineer named Sattyam Jain. A production CRM-sync agent made the same API call about 4,800 times per hour for 63 straight hours. Every call returned an HTTP 429 rate-limit error. Nothing stopped the agent until a human opened a laptop on Monday morning. The total token cost was around 4,200 dollars.
No benchmark tracks cumulative token cost across wall-clock time. No accuracy score measures whether an agent recognizes that it is in a loop. The metric that would have caught this does not exist in any framework's eval library. It had to be written by the team that built the system, based on what they saw their system actually do.
There is a longer history here. Air Canada was once held liable for a chatbot that fabricated a bereavement-fare policy that did not exist on its website. The chatbot was confidently wrong and the company paid for it in tribunal. The same class of failure, which is confident fabrication on top of stale grounding, still has no off-the-shelf metric. The legal exposure has grown over time. The catalog has not.
The pattern in all three of these examples is the same. The failure mode that costs you something is system-specific. It depends on what your system does, what data it works with, what tools it can call, and what users expect of it. The metric that catches the failure has to be specific in the same way. It cannot come from a generic library. It has to come from your trace data, where the specific failure already lives, waiting to be named. For the related problem of how often LLM-as-judge metrics get this wrong as well, see our piece on LLM-as-judge reliability and bias.
How to Derive Metrics From Production Traces
The methodology for deriving metrics from production traces is straightforward to describe and slow to do well. The clearest published statement of it comes from an essay by Hamel Husain and Shreya Shankar, written from lessons teaching the methodology to more than 700 engineers and product managers. Their core line is worth quoting. Write evaluators for errors you discover, not errors you imagine.
The loop has four steps.
The first step is to log everything. That means inputs, intermediate state, retrieved context, tool calls, outputs, and user signals like thumbs-up, thumbs-down, abandonment, and escalation. Without rich traces, the rest of the loop is impossible because there is nothing to look at.
The second step is to cluster failures. You sample 100 to 300 traces where the user signaled dissatisfaction or where the business outcome was wrong. You read them. Then you group them by failure pattern, not by output similarity. The clusters matter. The surface text of the outputs does not.
The third step is to name each cluster in plain language. The name has to be specific enough that someone writing the metric will know what to check. Hallucination is not a name. Bot answers from a cached policy page when the current policy contradicts it. An agent attempts a destructive operation without asking for permission. The specificity of the name is what makes the metric writable in the first place.
The fourth step is to write a metric per cluster. The metric can be an LLM-judge prompt that checks for the specific failure pattern. It can be a code-based check, like a regex or a schema validator. It can be a hybrid. The size of the cluster tells you how often the failure happens. The business impact of the cluster tells you how heavily to weight the metric.
This methodology has academic backing now, not just practitioner posts. Jha and co-authors at Meta published REAP, a framework for automatically curating coding-agent benchmarks from real developer-agent interactions. On their production-derived benchmark, called Harvest, frontier models hit solve rates between 42.9 and 58.2 percent. Those are the same models that post 70 to 80 percent on SWE-Bench Verified. The methodology can be automated. The gap between benchmarks and production is real, measurable, and stable across approaches.
The AGENTRX paper took annotated production traces and built a cross-domain failure taxonomy from them. It is a sign that trace-driven failure taxonomies are now an active research direction, not just an internal practice on a handful of teams. The broader version of this philosophy is sometimes called eval-driven development, and the fuller treatment lives at our guide to eval-driven development.
What Most Teams Get Wrong About It
The methodology I just described is no longer contested in 2026. Several vendor platforms have shipped trace-to-eval features. The Husain and Shankar essay is widely read. The argument for deriving metrics from traces has moved from contrarian to default.
What separates teams now is execution. Five mistakes keep coming up again and again.
The first mistake is clustering at the wrong granularity. Teams that cluster too coarsely end up with three or four catch-all categories like factual errors, tone problems, and format breaks. Those clusters are too generic to write actionable metrics against. Teams that cluster too finely end up with hundreds of one-off categories that no one maintains over time. The right range is usually 8 to 20 named clusters, where each cluster covers at least 3 percent of observed failures.
The second mistake is naming failures poorly. The name of a cluster becomes the specification for a metric. If the name is vague, the metric will be vague too. Hallucination is vague. The bot recommends a competitor product when ours is in stock. Agent omits a required disclaimer on regulated topics is specific. The work of writing a good cluster name is the same work as designing a good metric.
The third mistake is calibrating LLM-judges against 2024's biases. For two years, the dominant judge-bias problem was position bias, where the judge favored whichever output came first. Most teams optimized their evaluation pipelines around this. Soumik's paper, Judging the Judges, ran the most comprehensive judge-bias study to date. It tested five frontier judge models across three benchmarks and 825 test cases. The finding is striking. Position bias is now small, at around 0.04 across major judges. Style bias is the dominant problem, with magnitudes between 0.76 and 0.92. Judges favor outputs that match the style of the reference answer, regardless of whether the content is correct. Most teams are still optimizing for the bias that does not matter anymore.
The fourth mistake is reaching for the biggest judge model by default. Larger is not always more accurate for domain-specific evaluation. The right test is whether the judge agrees with your team's human reviewers on your domain. A smaller model that has been calibrated against your traces will often beat a larger general-purpose model that has not.
Test multiple judges. Pick the one your domain prefers, not the one with the most parameters.
The fifth mistake is treating the eval suite as a launch deliverable. Production failures evolve. New use cases appear. Models get updated underneath you. The eval suite that helped your product launch is rarely the eval suite that keeps it running six months later. Most teams set up their eval pipeline before launch and never seriously rework it afterward. The pipeline goes stale. The metrics stop catching what users complain about. Eventually, someone rebuilds the eval stack from scratch, which is a lot of work that could have been avoided by treating evals as a living system from the start.
When Generic Metrics Still Help
None of this means generic metrics are useless. The catalog has its place. The question is where to put it.
Faithfulness and grounding metrics check whether an answer is actually supported by the documents the agent retrieved. For retrieval-augmented systems, that is a common failure mode. Why? Because the retrieval is rarely perfect, and the LLM will often fill in the gaps with confident-sounding details that were not in the documents at all. The catalog metric flags this cheaply, so you do not have to write a check from scratch.
LLM-as-judge is useful for high-volume scoring, as long as the judge has been calibrated against your traces. The methodology itself was established by Zheng's team in the original paper Judging LLM-as-a-Judge with MT-Bench and Chatbot Arena. They showed that GPT-4 reaches around 80 percent agreement with human raters on chat preference tasks, which is roughly the same agreement rate humans have with each other. That is good enough for most cases, but only if you have first checked that your particular judge agrees with your particular humans on your particular task.
Semantic similarity metrics are useful when you have reference answers to compare against, which is more common in retrieval-augmented systems than in open-ended generation.
The pattern that works is to put generic metrics at the bottom of the funnel and trace-derived metrics at the top. Generic metrics are cheap and fast. They catch the obvious problems before anything else has to look at them. Trace-derived metrics are expensive and specific. They catch the failures that hurt your product, which the generic metrics never would have noticed.
The Continuous Loop
Eval suites decay the way any other software artifact decays. As your product changes, as user behavior shifts, as production failures evolve, a frozen eval suite measures what your system used to fail at. The suite that helped you launch is rarely the suite that should be running when you have been in production for two years.
The loop has to be continuous. Every quarter, you sample new traces. You check whether the failure clusters have shifted. You add metrics for clusters that have appeared, and you retire metrics for clusters you have closed out. The eval suite becomes a living artifact instead of a launch deliverable.
The gap between teams that ship strong eval suites and teams that keep them current is widening over time, not closing. The teams that win on agent quality six months from now will not be the ones with the most evals at launch. They will be the ones with the freshest evals after a year of running in production. For the broader picture, the complete guide to LLM and AI agent evaluation covers how trace-derived metrics fit into a full evaluation program. For the upstream side, where you actually capture the traces these metrics are derived from, see why agent observability requires runtime per-span verdicts.
Closing
The metrics that catch your worst failures are the ones you wrote after you saw them happen. That was the contrarian argument in 2024. In 2026, it is the consensus, and what separates teams now is how they cluster, how they name, how they calibrate, and how they keep the loop continuous.
Most eval suites that helped a product launch will be obsolete within six months. The ones that stay useful will be the ones that live downstream of the trace, not upstream of the framework.